Why do two North Tustin homes that look similar on paper sell for very different prices? If you have wondered whether it is the lot, the view, or the renovation that moves the needle, you are not alone. North Tustin is a foothill market where land, livability, and design work together to set value. In this guide, you will learn how buyers and appraisers weigh each factor, how to read recent sales, and what to improve before you list. Let’s dive in.
North Tustin market snapshot
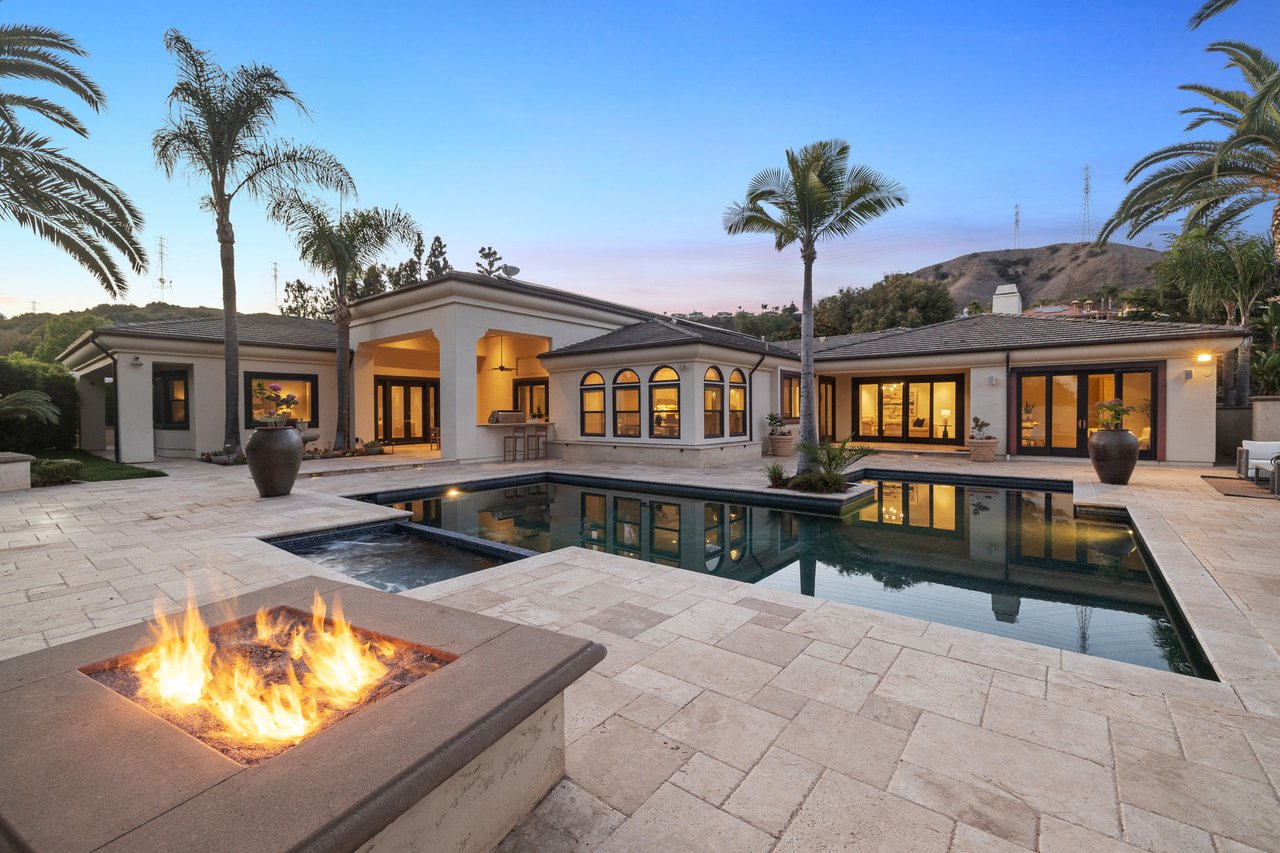
North Tustin sits among Orange County’s higher-value pockets, with prices shaped by larger lots, hillside topography, and view potential.
- Zillow Home Value Index (ZHVI) for North Tustin: $1,701,863. Data through Jan 31, 2026; figure retrieved Mar 3, 2026. Source: Zillow ZHVI.
- Redfin reported a median sale price of $1,499,000 in Jan 2026, down 0.23% year over year. Median price per square foot was about $635. Figure retrieved Mar 3, 2026. Source: Redfin city snapshot.
- Rocket Homes’ June 2025 snapshot showed a median sold price of $1,716,250 and a 12‑month median of $723 per square foot. Figure retrieved Mar 3, 2026. Source: Rocket Homes market report.
What this means for you: different data sets use different samples and methods. Treat these as broad context, not a substitute for a customized comparable market analysis on your specific home.
The North Tustin micro-markets
North Tustin is an unincorporated census-designated place that includes foothill sub-areas often called Panorama Heights, Lemon Heights, Cowan Heights, Red Hill, and nearby Orange Park Acres. You will find many parcels between about 10,000 and 20,000 square feet, plus select estate and equestrian lots over half an acre. That mix is a core reason two similar homes can close hundreds of thousands of dollars apart. Learn more about the area’s structure and history on the North Tustin entry at Wikipedia.
What drives value here
Lot size and usable yard
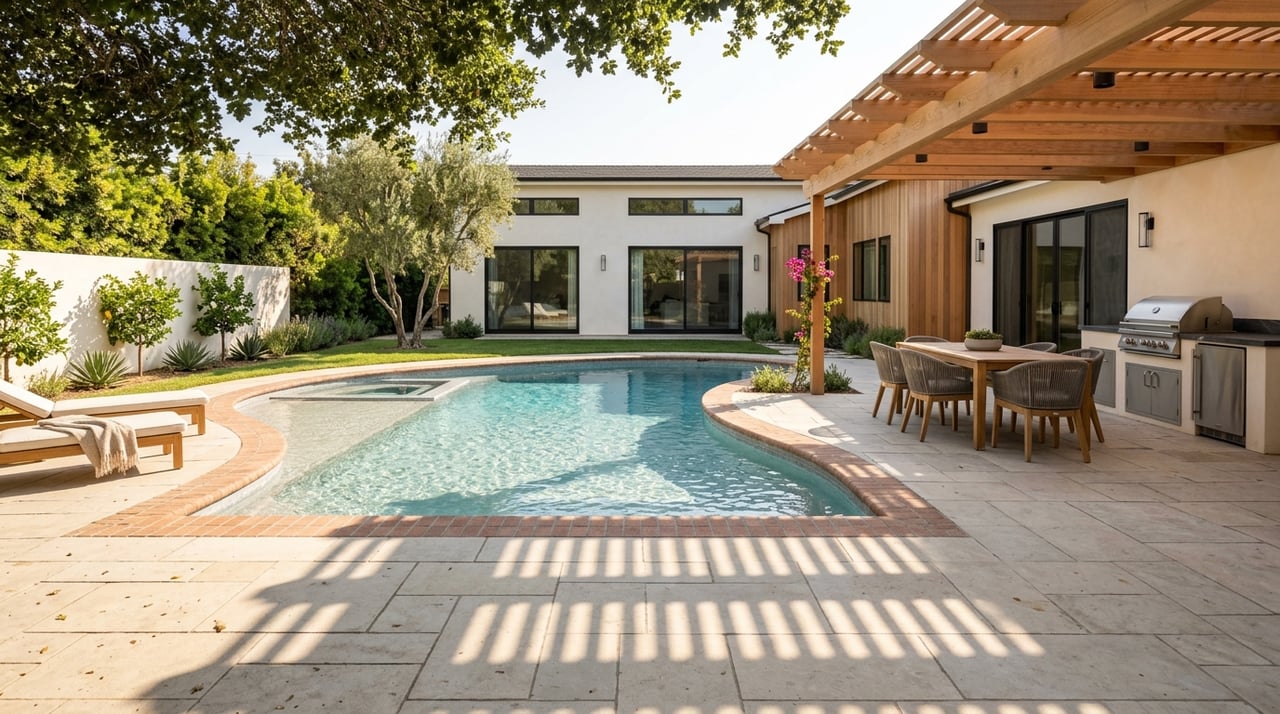
- Why it matters: Land holds independent value in the foothills. Larger, flatter yards allow pools, outdoor rooms, accessory dwelling units, and better privacy. Net usable area usually wins over raw lot size.
- How to verify: Check the MLS lot-size field and confirm with the Orange County Assessor. You can verify APN, lot area, and tax basics on the county site at the Orange County Assessor’s buying and selling page.
- Tip: Steep slopes, long driveways, or easements can reduce usability even on a large lot.
Views, orientation, and permanence
- Why it matters: Panoramic city-light or horizon views often trade at a premium. The size of that premium depends on quality and whether the view is likely to be blocked in the future.
- How to verify: Compare paired sales on the same ridgeline, review listing photos and elevation/topography, and confirm planning or zoning that could affect future obstructions. Appraisers prefer paired-sales evidence; see the Fannie Mae Selling Guide for methodology expectations.
Floor plan and style
- Why it matters: Open and functional layouts that connect to outdoor spaces generally outperform closed or compartmentalized plans. Architectural style can help, but flow and finish are what most buyers pay for.
- How to verify: Study listing floor plans and photos, and confirm any additions or reconfigurations through permit history.
Renovation level and permitted work
- Why it matters: Kitchens, baths, flooring, lighting, and overall systems condition drive buyer perception and appraised value. In the Pacific region, selected projects often recoup a significant share of cost at resale. Review typical ROI patterns in the latest Cost vs. Value report.
- How to verify: Compare interior photos, disclosures, and permit records. Unpermitted improvements may not receive full credit in an appraisal. Start with the Assessor’s page for buyers and sellers and request permit histories from the appropriate jurisdiction.
Schools, neighborhood reputation, and amenities
- Why it matters: Many buyers use public school assignments and commuter access as filters. In North Tustin, listings often highlight local schools and proximity to services. Keep language neutral and verify assignments with official district resources before relying on them in pricing.
Taxes, special assessments, and Mello-Roos
- Why it matters: Monthly carrying cost affects demand. Homes within a Community Facilities District with Mello-Roos or higher voter-approved debt lines can trade differently than similar homes without those assessments.
- How to verify: Review the seller’s current tax bill for special taxes. Use the county’s Mello-Roos viewer to confirm CFD status and factor the annual amount into monthly cost comparisons.
Environmental risk and insurance
- Why it matters: Foothill parcels may intersect updated Fire Hazard Severity Zones, which can affect code requirements, buyer demand, and insurance costs.
- How to verify: Check the county’s fire hazard resources at the Orange County Fire Hazard Zones map and review any climate risk indicators displayed on property listings.
How to read price gaps between “similar” homes
Use this five-part sequence to make sense of $100,000 to $500,000 differences.
- Confirm the parcel details
- Pull the address and APN, then verify lot size and tax history with the Orange County Assessor. Ask the owner for the most recent tax bill so you can see special assessments.
- Build a tight comp set
- Focus on sales from the past 3 to 6 months in the same micro-area or ridgeline, ideally within a half mile. Match lot size and view first, then interior square footage. Appraisal practice supports this approach; see the Fannie Mae Selling Guide for comp selection standards.
- Adjust for objective differences
- Itemize square footage, bedroom and bath count, garage capacity, pool, ADU, and year built. Convert size differences to dollars using the local per-square-foot range from your comp set, not a single countywide average.
Example: If a nearby sale is 400 square feet larger and your comp sample supports $650 per square foot, start with a $260,000 gross difference, then refine for view, condition, and lot usability.
- Isolate subjective items with paired sales
- View, privacy, and renovation level require paired-sales comparisons. Look for two very similar sales that differ mainly in the attribute you are testing. Appraisers rely on time-appropriate, market-backed adjustments. For a practitioner’s perspective on adjustments, see this overview from Appraisal Today.
- Reconcile to a value range
- Present a low, mid, and high scenario supported by the evidence. Explain the dollars you assigned to each difference and the comps that justify them. This mirrors how appraisals document logic and support.
Real sales that explain the market
Below are recent examples that illustrate how land, views, and size shape pricing. Sale details are drawn from public-record aggregators and MLS-reported data. Always confirm specifics through an agent pull before you rely on them.
12276 Circula Panorama — Sold $1,706,000 on Feb 9, 2026; about 2,320 square feet. Panoramic views in Panorama Heights and a comfortable mid-century plan helped drive a price near $735 per square foot. This is a clear view premium example.
12931 Prospect Ave — Sold $1,200,000 on Dec 4, 2025; approximately 1,394 square feet on an 18,000+ square foot lot. The high per-square-foot price, about $861, signals the market was paying for land value and potential more than interior size.
11141 Limetree Drive — Listing and sale activity noted around Oct 2025; about 3,042 square feet on roughly 0.43 acre. It was marketed near $3,000,000 at that time, reflecting a premium ridgeline setting with expansive views and multigenerational flexibility. Larger, high-view lots can push absolute price higher even if $/sqft varies with size.
12441 La Bella Dr — Sold $1,680,000 in Dec 2025; about 2,588 square feet, or near $650 per square foot. Solid lot and finishes without a dramatic view component kept the per-square-foot pricing in a more moderate range.
12941 Villa Rose Dr — Sold $2,500,000; about 4,035 square feet, near $620 per square foot. Larger homes often show lower $/sqft even when the total sale price is much higher.
Takeaway: in North Tustin, small homes on oversized lots can sell at high $/sqft because land is scarce and valuable. Strong ridge views can command a premium that shows up both in $/sqft and overall price. Very large homes often see lower $/sqft, but their absolute price is still higher.
Preparing to sell: design-forward upgrades that pay
If you plan to list in the next 3 to 12 months, focus on improvements that show well and appraise cleanly.
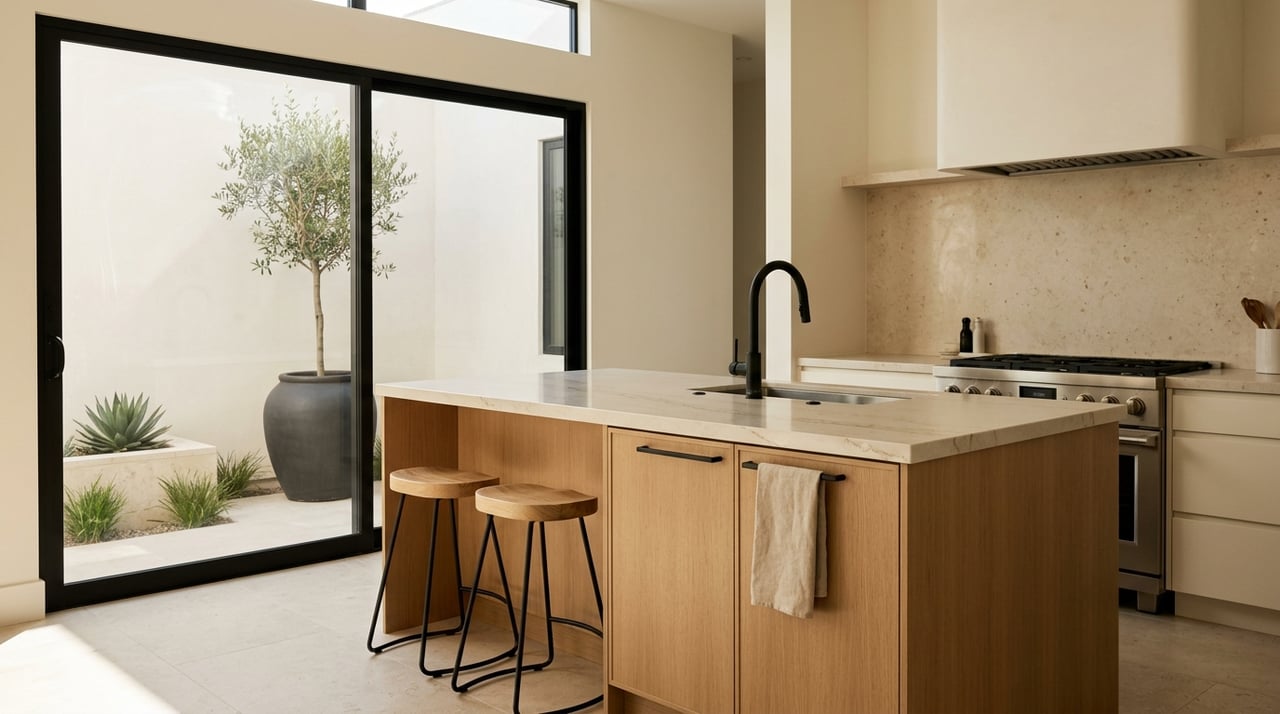
- Prioritize kitchens, baths, and lighting. In the Pacific region, select kitchen and bath updates often return a strong share of cost. Review regional ROI patterns in the latest Cost vs. Value tables.
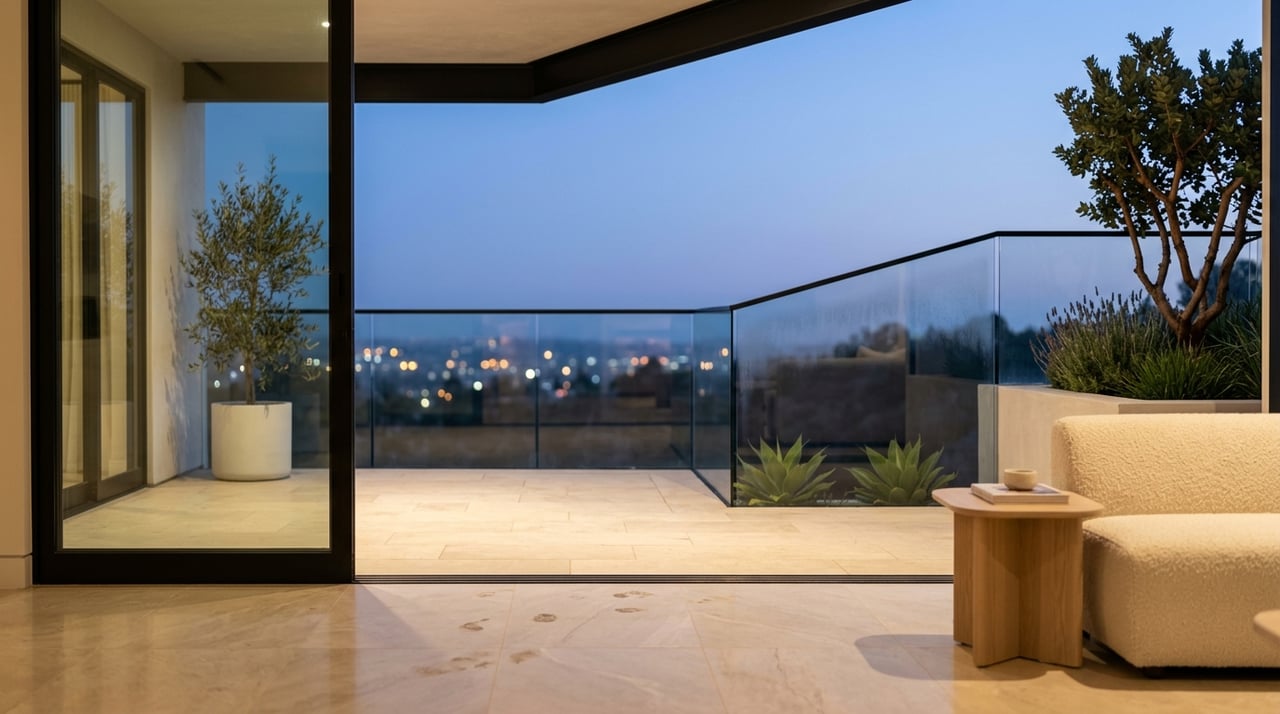
- Maximize indoor–outdoor flow. Clear sightlines, refreshed sliders, and a defined outdoor room help buyers feel the North Tustin lifestyle.
- Document permits and scope. Organized records help appraisers and buyers assign value. Start a clean folder of invoices, permits, and warranties.
- Stage for volume and light. Lean, modern staging helps the foothill light read as a feature and supports premium photography and marketing.
Smart due diligence for buyers
- Verify lot and tax details. Use the Assessor’s site and request the current tax bill for special assessments.
- Check fire hazard resources. Review the county’s Fire Hazard Zones map and discuss insurance with your carrier early.
- Confirm school assignments with official district tools. Treat portal ratings as a starting point only and keep language neutral.
- Value the micro-location. Elevation, exposure, and ridgeline position can change your daily experience and long-term resale.
The bottom line
Understanding home values in North Tustin comes down to reading land, view, layout, and condition through the lens of very local comps. Start with the parcel and micro-market, build a tight comp set, assign defensible adjustments, and present a supported range. If you are selling, targeted design updates and strong presentation can elevate your price ceiling. If you are buying, careful due diligence and paired-sales thinking help you avoid overpaying while securing the right fit.
If you want a data-backed valuation paired with a design plan to maximize your outcome, connect with Cindi Karamzadeh Real Estate + Design for a design-forward market consultation tailored to your home.
FAQs
What is the typical home value in North Tustin today?
- Public aggregators show a general range around the mid $1.5 to upper $1.7 million mark depending on the sample, with ZHVI at $1,701,863 as of Jan 31, 2026 (retrieved Mar 3, 2026) and other sources showing near $1.5 million median sale price in Jan 2026.
Why do similar North Tustin homes sell at very different prices?
- Lot usability, ridge views, renovation level, and Mello-Roos or special taxes often explain six-figure differences even when interior size looks similar on paper.
How do I verify lot size, APN, and special assessments before I offer?
- Use the Orange County Assessor’s site to confirm APN and lot size and ask for the latest tax bill to see any Mello-Roos or voter-approved debt lines.
Do views have a standard dollar value in North Tustin?
- No; view premiums vary by quality and permanence. Use paired sales on the same ridgeline to isolate the premium and follow Fannie Mae guidance on supported adjustments.
Which upgrades usually add the most resale value here?
- Well-executed kitchen and bath updates, lighting, and improved indoor–outdoor flow often deliver strong ROI; consult the regional Cost vs. Value report and a local comp set for calibration.
How do wildfire hazard designations affect buying or selling?
- Higher hazard zones can influence insurance availability and buyer perception; check the county’s Fire Hazard Zones map and discuss options with your insurer early.